Reporting
Generating Graphs
To generate a graph for the reports available through the Reporting menu, you will need to:
Navigate to your required reporting page
E.g. Reporting > Relationship Performance Report
To create a graph, click on the value from the column you are reporting on
The graph will be generated in a pop-up window

Selecting the Reporting Time Frames
Perimeter offers multiple ways of determining the time frames for generating reports:
Using the predetermined time frame buttons
Using the Calendar tools
Selecting Time Frames with the Predetermined Buttons
Click on one of the available time frames which are located at the left of the reporting pages. The report will be generated again with the new time frame applied.

To display recent information, the following time frames are available as buttons:
Today: from midnight (12:00 am) to the current time
Yesterday: from midnight (12:00 am) previous day to the end of the previous day (11:59 pm)
Last Week: from 7 days ago (12:00 am) to the current time
Last Hour: from the beginning of the current hour to the current time
Last 15 minutes: 15 minutes earlier than current time
Last 10 minutes: 10 minutes earlier than the current time

Selecting Time Frames with the Calendar Tools
You can choose specific dates and times for the reporting time window using the Calendar Tools. Those are located on the right of the reporting pages.

To select a Time Frame only with calendar dates
Click on the boxes containing the dates to open a calendar view
Choose the ‘from’ date by clicking on a date
Choose the ‘to’ date by clicking on a later date
Click on Generate
A new report will be generated for the new time window.
To further narrow the scope, select a Time Frame with calendar dates and times:
Click on the left box containing the date and to open a calendar view
Choose the ‘from’ date by clicking on a date
Click on Select Time to toggle the time picker
Choose the ‘from’ time by clicking on a time
Press on OK
Choose the ‘to’ date by clicking on a later date
Click on Select Time to toggle the time picker
Choose the ‘to’ time by clicking on a time
Press on OK
Click on Generate

Zooming in on Graphs
The default view in the Dashboard Reports is set to view 24 hours. There are multiple ways to zoom in, such as:
Using the Zoom buttons located on the left side of the reporting tool
By selecting the area you want to zoom on the graph
Using the interactive controller at the bottom to select the area you want zoomed

Dashboard
In the Dashboard, you are able to view high-level graphs and key measurements which display the most recent data.
Key Performance Indicator Headings
Dashboard
At the top of the Dashboard page, you can see the following KPI data:
Daily Minutes - Number of minutes used by customers in the last day
Daily Attempts - Number of successful attempts made by customers in the last day
Daily Profit - Amount of profit made in the last day
Daily Margin % - The margin made in the last day as a percentage
Daily PRV - Predicted Routing Value
Daily ASR - The answer-seizure ratio for the last day; the percentage of telephone calls which are answered
Daily ALOC - The average length of conversation for the last day
Dashboard Graphs
Dashboard
On the graph, you can view data from:
The current day: Green line
The previous day: Blue line
Seven days ago: Red line
The following graph reports are available:
Termination Minutes - describes the conversation minutes associated to the Termination Relationships
Origination Minutes - describes the conversation minutes associated to the Origination Relationships
Termination Attempts - describes the number of initiated calls associated to Termination Relationships
Origination Attempts - describes the number of initiated calls associated to Termination Relationships
Ports - describes the total number of ports used at specified times
CPS - describes the number of calls which has a carrier pre-selected
Profit - describes the total amount of profit made at specified times
Reporting Menu
From the Reporting menu, you can create bespoke reports for a variety of metrics. The reports generated here have the following functionality:
Determine the time frames for creating a report
Create a graph based on individual metrics attributed to a relationship such as profit, revenue, filters, and duration.
Export all reports as a comma separated value (.csv) file
View the performance from both a Customer and a Vendor perspective

Relationship Performance Report
Reporting > Relationship Performance Report


The Relationship Performance report is a comprehensive reporting system which can generate graphs for individual metrics from all type of relationship configurations, such as:
Termination-Vendor Revenue Generation
Origination Capacity - Customer Signaling Ports
From the Relationship Performance Report Dashboard, you can:
Choose between the Vendor and Customer perspectives using the drop-down menu located at the top left of the page.
Switch between different types of reports using the tabs located at the top right of the page
Select the Time Frames for generating the report
Using the Calendar Tools
Using the pre-configured time frame buttons
Export the report as a .csv file
Generate graphs for each available metric

Termination / Origination Tabs
Reporting > Relationship Performance Report
The tab reports on the following metrics:
Attempts - attempted calls
Completes - completed calls
Minutes - minutes completed on calls; determined by the rounding value chosen during the relationship configuration
ASR % - The answer-seizure ratios; the percentage of telephone calls which are answered
ALOC - Average length of calls in minutes
Revenue - amount of revenue generated in the specified time frame
Cost - amount of cost supported in the specified time frame
Profit - amount of profit generated in the specified time frame for
Margin % - difference between the profit and the cost expressed as a percentage
PPM - Profit Per Minute
PRV - Predictive Routing Value
NEPR % - Not Enough Profitable Routes as a percentage; If you have Profit Protection toggled ON and the system does not find a profitable route, the call will not connect but will be route advanced with the 503 SIP code
SDR % - Number of calls with a duration of under 6 seconds
MOS - Mean Opinion Score; auto-generated by Perimeter
LCR Depth - Least Cost Routing depth; the number of carriers that the call has been routed through to achieve call completion

Termination / Origination Media Tabs
Reporting > Relationship Performance Report
The tabs report on the following metrics:
Attempts - attempted calls
Completes - completed calls
Minutes - minutes completed on calls; determined by the rounding value chosen during the relationship configuration
ASR % - The answer-seizure ratios; the percentage of telephone calls which are answered
ALOC - Average length of calls in minutes
Revenue - amount of revenue generated in the specified time frame
Cost - amount of cost supported in the specified time frame
Profit - amount of profit generated in the specified time frame for
Margin % - difference between the profit and the cost expressed as a percentage
PPM - Profit Per Minute
PRV - Predictive Routing Value
NEPR % - Not Enough Profitable Routes as a percentage; If you have Profit Protection toggled ON and the system does not find a profitable route, the call will not connect but will be route advanced with the 503 SIP code
SDR % - Number of calls with a duration of under 6 seconds

Termination / Origination Capacity Tabs
Reporting > Relationship Performance Report
The tabs report on the following metrics:
Signaling Ports - Number of signaling ports as a percentage of the total ports
Media Ports - Number of ports supporting media filtering
Answered Ports - Number of answered ports as a percentage of the total ports
CPS - number of Carrier Pre-Selected ports as a percentage of the total ports
CPS Ratio - Ratio between number of concurrent calls and CPS
Attempted CPS - number of calls attempted through Pre-Selected Carriers
Attempted Ratio - Ratio between attempted normal port allocations and CPS allocation

Capacity Group Report
Reporting > Relationship Performance Report > Capacity Group Report
The tabs report on the following metrics:
Signaling Ports - Number of signaling ports as a percentage of the total ports
Media Ports - Number of ports supporting media filtering
Answered Ports - Number of answered ports as a percentage of the total ports
CPS - number of Carrier Pre-Selected ports as a percentage of the total ports
CPS Ratio - Ratio between number of concurrent calls and CPS
Attempted CPS - number of calls attempted through Pre-Selected Carriers
Attempted Ratio - Ratio between attempted normal port allocations and CPS allocation
Bursting Report - Exports report which pulls peak utilization for the groups based on the timeframe specified.

Hourly Performance Report
Reporting > Hourly Performance Report
The Hourly Performance Report displays your network’s performance by hour based on the customer or vendor.
Termination / Origination tabs
Reporting > Hourly Performance Report > Origination / Termination
To filter the dates for the Performance report you need to:
Use the
Predetermined time intervals
Calendar function and Generate
Pess Export
In the new window, provide a name for the exporting .csv file and press Export

The Termination and Origination tabs feature the following metrics:
Attempts
Completes
Minutes
ASR %
ALOC
Revenue
Cost
Profit
Margin %
PPM
PRV
NEPR %
SDR %
MOS
LCR Depth
Traffic History tab
Reporting > Hourly Performance Report > Traffic History
To generate a Traffic History Report:
Select the time zone from the drop-down menu
Select the time interval for the report using the calendar tools
Select from the drop down menus
Customer / Vendor
Termination / Origination
Relationship
Trunk
Press Generate

The Traffic History tab features the following metrics:
Date
Destination
Trunk Group
Attempts
Completes
Minutes
Revenue
Destination Performance Report
Reporting > Destination Performance Report
In this reporting window, you can view the performance of your network based on the destination of the call routing.
You can configure this report in the following ways:

Attempts - attempted calls
Completes - completed calls
Minutes - minutes completed on calls; determined by the rounding value chosen during the relationship configuration
ASR % - The answer-seizure ratios; the percentage of telephone calls which are answered
ALOC - Average Length of Call
Revenue - amount of revenue generated in the specified time frame
Cost - amount of cost supported in the specified time frame
Profit - amount of profit generated in the specified time frame for
Rate (International Only) - rate charged per minute
Margin - ratio of profit to revenue.
SDR % - Number of calls with a duration of under 6 seconds
404 % - Amount of attempts made to bad ANIs as a percentage
487 % - Request has terminated by bye or cancel as a percentage
LCR Depth - Least Cost Routing depth; the number of carriers that the call has been routed through to achieve call completion
LATA-OCN Report
Reporting > LATA-OCN Report
This reporting tool allows you to view stats per LATA/OCN and Carriers instead as opposed to viewing them in a nested structure. From the dashboard you can:
Choose between the Origination and Termination report
Select the type of report
LATA
OCN
Relationship
Select the type of relationship
Customer
Vendor
The page reports on the following metics:
Relationship
Attempts
Completes
ASR
Minutes
Revenue
Cost
Profit
Margin %
SDR %
404 %
487 %
LCR Depth

CDR (Call Detail Record) Diagnostic Report
This reporting tool enables you to retrieve Call Detail Records. You can identify both completed calls and live calls by using multiple filters.
Termination / Origination Tabs
Reporting > CDR Diagnostic Report
You can identify both Termination and Origination calls by selecting the appropriate tab at the top right of the page. Both tabs enable you to retrieve CDRs using the following filters:
Customer - select the customer based on the configured relationships
Vendor - select the vendor based on the configured relationships
ANI - provide the ANI
Dialed Number - provide the dialed number
Maximum Duration
Minimum Duration
SIP Caller ID
Call ended status
All
Completed
Uncompleted
Cause Code - provide Cause Code
Call Path - This will pop up a window which shows the vendors that were tried and the SiP message received.
Trace - This will trigger the download of a pcap for the call. You can open it using wireshark or any other pcap reading software you prefer.
Download CDR report

Lookup LRN
Reporting > CDR Diagnostic Report >Termination/Origination tabs
Lookup the Dialed number and retrieve the following:
LRN - Location Routing Number
OCN - Operating Company Number
LATA - Local Access and Transport Area
STATE - USA States
RATECENTER - geographically-specific area used for determining mileage and/or usage dependent rates

Fields
Reporting > CDR Diagnostic Report >Termination/Origination tabs
The CDR Report’s Termination and Origination tabs report on the following metrics:
Date Time - date and time the call took place
ANI - from number for the call
DNIS - to number for the call
LRN : LRN if the call was LRNed
Release Cause: Reason for release code
Release Code : SIP code
Duration: Duration of the call
Customer: Customer call came from
Customer Trunk: Trunk group name
Vendor: Vendor call went to
Vendor Trunk: Trunk group name
Orig Juris: call originated from jurisdiction
Orig Cost: cost to the customer
Term Cost: cost from the vendor
PDD (ms): PDD of the call
Call Path: pop up window to show the b-leg call attempts and release codes
Trace: pcap for the call
Action: export the cdr for the call
CDR Export
Reporting > CDR Diagnostic Report
This tab enables you to view and download previous CDR exports.

Live Calls
Reporting > CDR Diagnostic Report
The Live Calls report enables you to see the currently connected calls on your network.
You can filter the list of current calls using the following filters:
Incoming Trunk Group - Select the trunk group from the drop-down menu
Outgoing Trunk Group - Select the trunk group from the drop-down menu
Limit - the number of live calls to be displayed
You can also click on Refresh to update the list in case calls end and others have started.

Fields
Reporting > CDR Diagnostic Report > Live Calls
The CDR Report’s Live Call tab reports on the following metrics:
Originating Relationship - the originating relationship the call is routed from
Originating Trunk Group - the originating trunk the call is routed from
Terminating Relationship - the terminating relationship the call is routed to
Terminating Trunk Group - the terminating trunk the call is routed to
Start - start time of the call
ANI - Automatic Number Identification
DNIS - Dialed Number Identification Service
Duration - how long the call lasted
Kill Call - manually operate to terminate the call
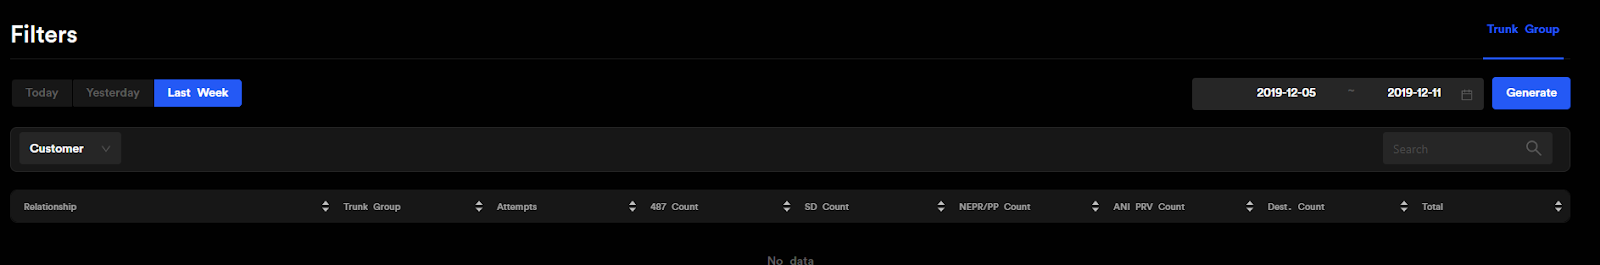
Filter Report
This report enables you to view the filters used from both a customer and a vendor perspective. It reflects the filters that have been set on the route plans.
Fields
Reporting > Filter Report
The tab reports on the following metrics:
Relationship - select the relationship to report on
Trunk Group - specified trunk group within the above relationship
Attempts - number of call attempts
487 Count - number of calls terminated by bye or cancel
SD Count
NERP/PP Count
ANI/PRV Count
Dest. Count
Total
PPM Distribution Report
Reporting > PPM Distribution Report
The Profit Per Minute Distribution Reports showcases which calls are the most profitable and their weight in the overall profit amount. The PPM Distribution Report has the following fields:
PPM - Profit Per Minute
Trunk Group - The trunk group with the associated PPM
Completions - number of completed calls per trunk group
Distribution (%) - the weight of the trunk group in the total profit as a percentage

ANI Performance Report
Reporting > ANI Performance Report
The Automatic Number Identifier Performance Report enables you to check on the performance of originating telephone numbers. The ANI Performance Report has the following fields:
ANI - specific ANI which the following fields will report on
Attempts - number of call attempts for the specified ANI
Completions - number of completed attempts for the specified ANI
ASR - answer-seizure ratio; percentage of telephone calls which are answered
SDR - short duration ratio; percentage of calls that are less than 6 seconds in duration
ACD - automatic call distributor
PPM - the profit per minute of the specified ANI
PRV - the process of using known historical behavior of each customer as it relates to each vendor and using that scoring system to determine the optimal routing order
Action

SIP Reason Report
Reporting > SIP Reason Report
The Session Initiation Protocol Reason Report allows you to see from a Customer and Vendor perspective the SIP Request Message. The SIP Reason Report has the following fields:
Name
Attempts
Percentage

Duration Report
Reporting > Duration Report
The Duration report enables you to see the amount of calls in each of the duration brackets from a Termination and Origination perspective for both Vendors and Customers. The duration of each bracket is as follows:
Up to 6 sec
7-12 sec
13-18 sec
19-24 sec
25-30 sec
31-60 sec
60+ sec

Related Articles
Origination-Customer Relationship Configuration
A Relationship is a network configuration between your company and your customers or vendors. By creating a Relationship, you will set up the routing logic and rates that enable you to capitalize on the phone calls made on your network. An ...302 Redirect Quick Start Guide
302 Redirect Quick Start Guide for STIR/SHAKEN Please read the following information: The general explanation, Peeredge implementation and routing logic information has been provided in the STIR/SHAKEN article. If you already have a 302 source that ...Origination NRC and MRC - Billing Profiles Guide
Origination NRC/MRC refers to the origination module for NRC (non-recurring charges) and MRCs (monthly recurring charges) that allows for charges to be configured for all assigned DIDs. The NRC/MRC configuration was designed in a manner to allow ...RM
The RM (Reporting Manager) is the main database component which contains all customer data and reporting data generated from CDR processing.PPM
The PPM acronym stands for Profit Per Minute. Various reports in the Reporting menu will show profit per minute so that you can maintain necessary margins.